Research
April 05, 2024
Consumer outlook
If the labor market remains healthy, consumers will have the confidence and wherewithal to continue spending in 2024.
A healthy labor market, coupled with excess savings that households accumulated during the pandemic, allowed consumers to continue spending at a robust pace last year. Now that those savings are largely depleted, the resiliency of households will be tested in 2024.
On the positive side, the expectation of falling interest rates and moderating inflation will offer some relief to households. However, disinflation is not deflation, and prices will remain elevated across many categories of their budget. This has the potential to expose cracks in the household balance sheet, such as rising debt and delinquency levels.
This article presents the latest trends in key indicators that impact consumers’ ability and willingness to spend. Visit this page throughout the year for ongoing analysis of the state of the American consumer.
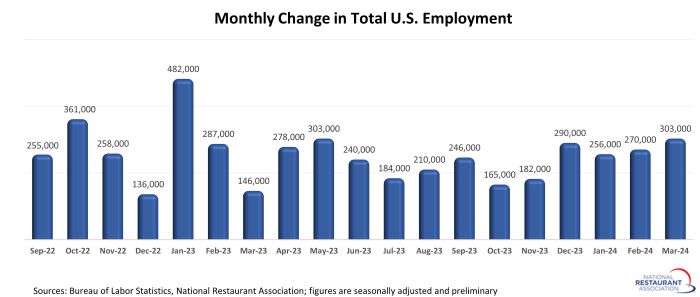
Labor market remains strong
Employed consumers will spend money, and the national labor market is showing little signs of fatigue. The national economy added more than 1.1 million jobs during the last 4 months, which is above the average rate of growth registered during 2023. While these strong monthly gains will likely not persist throughout 2024, the expectation is that employers will continue to expand payrolls at a moderate pace.
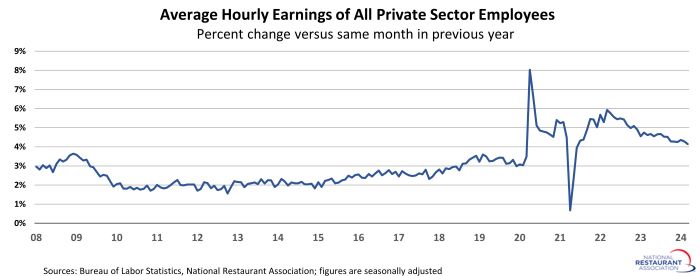
Wage growth remains healthy
Along with steady job growth, wages continue to increase at rates well above pre-pandemic levels. The 12-month gain in hourly earnings of private sector employees averaged 4.3% during the first quarter of 2024. While that was down somewhat from the average increase of 4.5% during 2023, it was a full percentage point above the 3.3% average gain during 2019.
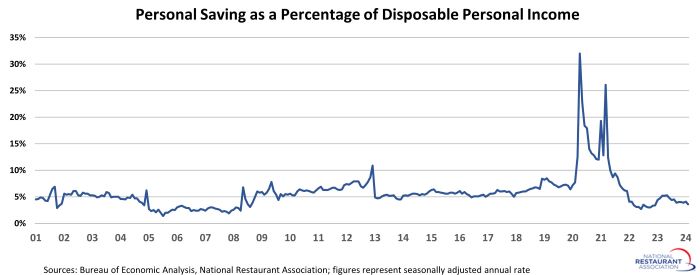
Savings rate dipped below pre-pandemic levels
Household savings soared during the first year and a half of the pandemic, driven primarily by reduced consumer activity as well as income-supporting fiscal stimulus packages. Many households used these excess savings to support elevated spending levels in 2022, which blunted the impact of soaring inflation. Savings rates are now below pre-pandemic levels, which means the financial cushion that many households established during the pandemic is being depleted.
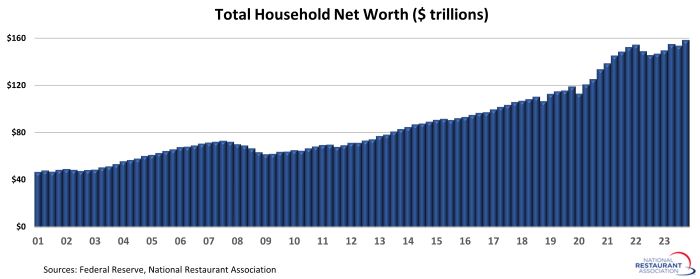
Household wealth at a record high
Household wealth rose to record highs during the pandemic, driven by a surging stock market and accelerating home values. These two indicators reversed trend in 2022, which resulted in a decline in total household net worth. By the end of 2023, total household net worth had rebounded to reach a new record high. While household wealth doesn’t directly determine the amount that most consumers can spend on a daily basis, its impact on confidence influences current and future financial decisions.
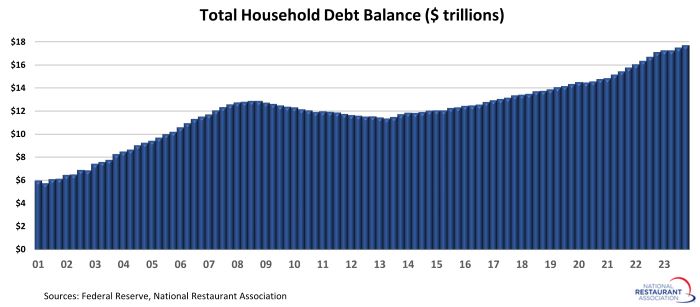
Household debt continues to rise
Household debt trended steadily higher during the pandemic, with aggregate balances reaching $17.5 trillion by 2023:Q4. That was $3.4 trillion higher than the 2019:Q4 level. Mortgages represent the bulk of household debt at 70%, followed by auto loans (9%) and student loans (9%).
Revolving credit rising sharply
Consumer credit balances fell to a 4-year low during the early months of the pandemic – primarily because households had fewer places to spend their money. That trend quickly reversed as restrictions eased and the economy reopened. Revolving consumer credit rose sharply in 2022 and 2023, wiping out all of the balance reductions posted during the early months of the pandemic. By the January 2024, total revolving credit balances topped $1.3 trillion – more than $200 billion (or 19%) above their pre-pandemic peak.

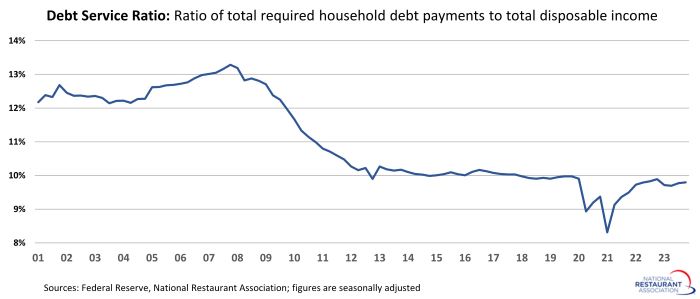
Debt service remains in check
Despite the elevated debt levels, debt service remains manageable for households on the aggregate. The Federal Reserve’s Debt Service Ratio, which is the ratio of total required household debt payments to total disposable income, was just under 10% in 2023:Q4. While that was higher than the lows posted during the first half of 2021, it was generally on par with pre-pandemic readings.
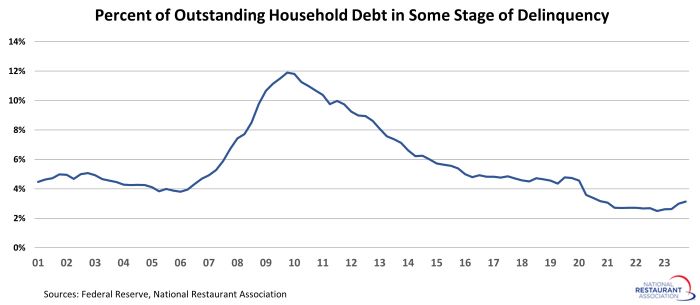
Overall delinquency rates are low
With debt service at manageable levels, overall delinquency rates remain in check. As of 2023:Q4, only 3.1% of outstanding household debt was in some stage of delinquency. While this was up 0.6 percentage points from the 2022:Q4 level, it remained well below the 2019 average of 4.6%.
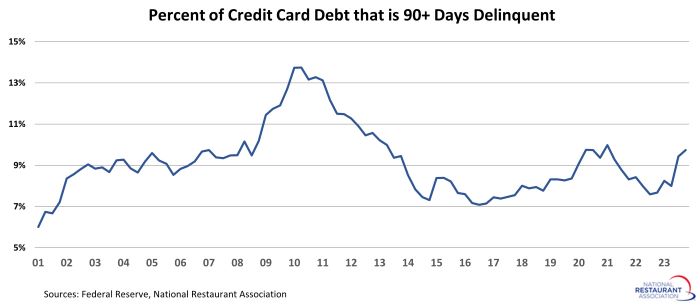
Credit card delinquencies trending higher
Overall delinquency rates remain low, but the percent of credit cards that were severely delinquent rose sharply in recent quarters. As of 2023:Q4, 9.7% of credit card debt was at least 90 days delinquent. That was up from a recent low of 7.6% in 2022:Q3 and represented the highest level in nearly 3 years.
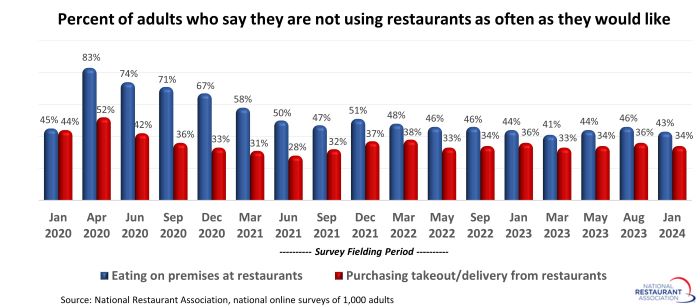
Pent-up demand holding firm
Based on the National Restaurant Association’s measures of pent-up demand, consumers will likely continue to visit restaurants in the coming months – as long as they have the financial wherewithal to do so.
Forty-three percent of adults say they are not going out to restaurants as often as they would like, according to a survey fielded January 19-21, 2024. That was essentially on par with consumers’ reporting in surveys fielded during the previous 12 months.
Meanwhile, 34% of adults say they are not ordering takeout or delivery from restaurants as often as they would like. That was also similar to readings in the last several surveys.
Not surprisingly, pent-up demand is higher among lower-income households, with 53% of consumers in households with income below $50,000 saying they would like to be going out to restaurants more frequently.
However, roughly 1 in 5 adults living in households with income above $100,000 also say they are not dining out at restaurants as often as they would like.
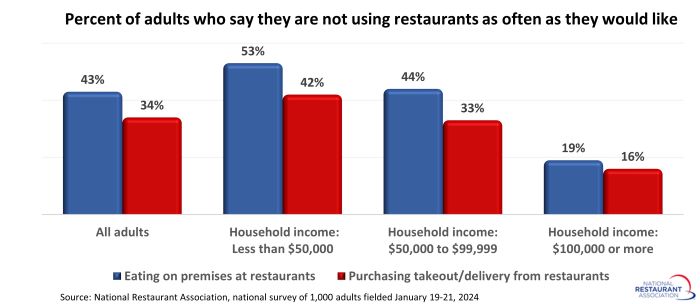
Any amount of unfulfilled demand among higher-income households is a positive sign for restaurants, as this demographic group represents the majority of spending in the industry.
According to data from the Bureau of Labor Statistics, households with incomes of $200,000 or higher are responsible for 24% of the total spending on food away from home, while households with incomes between $100,000 and $199,999 account for 33% of industry spending.
Taken together, households with income above $100,000 are responsible for nearly 6 in 10 dollars spent in restaurants.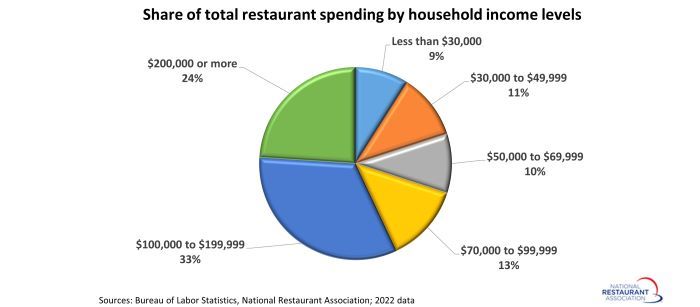
Read more analysis and commentary from the Association's economists, including the latest outlook for the economy.
On the positive side, the expectation of falling interest rates and moderating inflation will offer some relief to households. However, disinflation is not deflation, and prices will remain elevated across many categories of their budget. This has the potential to expose cracks in the household balance sheet, such as rising debt and delinquency levels.
This article presents the latest trends in key indicators that impact consumers’ ability and willingness to spend. Visit this page throughout the year for ongoing analysis of the state of the American consumer.
Labor market remains strong
Employed consumers will spend money, and the national labor market is showing little signs of fatigue. The national economy added more than 1.1 million jobs during the last 4 months, which is above the average rate of growth registered during 2023. While these strong monthly gains will likely not persist throughout 2024, the expectation is that employers will continue to expand payrolls at a moderate pace.
Wage growth remains healthy
Along with steady job growth, wages continue to increase at rates well above pre-pandemic levels. The 12-month gain in hourly earnings of private sector employees averaged 4.3% during the first quarter of 2024. While that was down somewhat from the average increase of 4.5% during 2023, it was a full percentage point above the 3.3% average gain during 2019.
Savings rate dipped below pre-pandemic levels
Household savings soared during the first year and a half of the pandemic, driven primarily by reduced consumer activity as well as income-supporting fiscal stimulus packages. Many households used these excess savings to support elevated spending levels in 2022, which blunted the impact of soaring inflation. Savings rates are now below pre-pandemic levels, which means the financial cushion that many households established during the pandemic is being depleted.
Household wealth at a record high
Household wealth rose to record highs during the pandemic, driven by a surging stock market and accelerating home values. These two indicators reversed trend in 2022, which resulted in a decline in total household net worth. By the end of 2023, total household net worth had rebounded to reach a new record high. While household wealth doesn’t directly determine the amount that most consumers can spend on a daily basis, its impact on confidence influences current and future financial decisions.
Household debt continues to rise
Household debt trended steadily higher during the pandemic, with aggregate balances reaching $17.5 trillion by 2023:Q4. That was $3.4 trillion higher than the 2019:Q4 level. Mortgages represent the bulk of household debt at 70%, followed by auto loans (9%) and student loans (9%).
Revolving credit rising sharply
Consumer credit balances fell to a 4-year low during the early months of the pandemic – primarily because households had fewer places to spend their money. That trend quickly reversed as restrictions eased and the economy reopened. Revolving consumer credit rose sharply in 2022 and 2023, wiping out all of the balance reductions posted during the early months of the pandemic. By the January 2024, total revolving credit balances topped $1.3 trillion – more than $200 billion (or 19%) above their pre-pandemic peak.
Debt service remains in check
Despite the elevated debt levels, debt service remains manageable for households on the aggregate. The Federal Reserve’s Debt Service Ratio, which is the ratio of total required household debt payments to total disposable income, was just under 10% in 2023:Q4. While that was higher than the lows posted during the first half of 2021, it was generally on par with pre-pandemic readings.
Overall delinquency rates are low
With debt service at manageable levels, overall delinquency rates remain in check. As of 2023:Q4, only 3.1% of outstanding household debt was in some stage of delinquency. While this was up 0.6 percentage points from the 2022:Q4 level, it remained well below the 2019 average of 4.6%.
Credit card delinquencies trending higher
Overall delinquency rates remain low, but the percent of credit cards that were severely delinquent rose sharply in recent quarters. As of 2023:Q4, 9.7% of credit card debt was at least 90 days delinquent. That was up from a recent low of 7.6% in 2022:Q3 and represented the highest level in nearly 3 years.
Pent-up demand holding firm
Based on the National Restaurant Association’s measures of pent-up demand, consumers will likely continue to visit restaurants in the coming months – as long as they have the financial wherewithal to do so.
Forty-three percent of adults say they are not going out to restaurants as often as they would like, according to a survey fielded January 19-21, 2024. That was essentially on par with consumers’ reporting in surveys fielded during the previous 12 months.
Meanwhile, 34% of adults say they are not ordering takeout or delivery from restaurants as often as they would like. That was also similar to readings in the last several surveys.
Not surprisingly, pent-up demand is higher among lower-income households, with 53% of consumers in households with income below $50,000 saying they would like to be going out to restaurants more frequently.
However, roughly 1 in 5 adults living in households with income above $100,000 also say they are not dining out at restaurants as often as they would like.
Any amount of unfulfilled demand among higher-income households is a positive sign for restaurants, as this demographic group represents the majority of spending in the industry.
According to data from the Bureau of Labor Statistics, households with incomes of $200,000 or higher are responsible for 24% of the total spending on food away from home, while households with incomes between $100,000 and $199,999 account for 33% of industry spending.
Taken together, households with income above $100,000 are responsible for nearly 6 in 10 dollars spent in restaurants.
Read more analysis and commentary from the Association's economists, including the latest outlook for the economy.