Restaurant occupancy costs were more than 5% of sales in 2024
Occupancy costs represent a larger share of overall restaurant expenses in urban areas. That’s one of the findings from the 2025 edition of the National Restaurant Association’s Restaurant Operations Data Abstract, which was released in August.
The Abstract is based on financial and operating data provided by more than 900 restaurant operators nationwide.
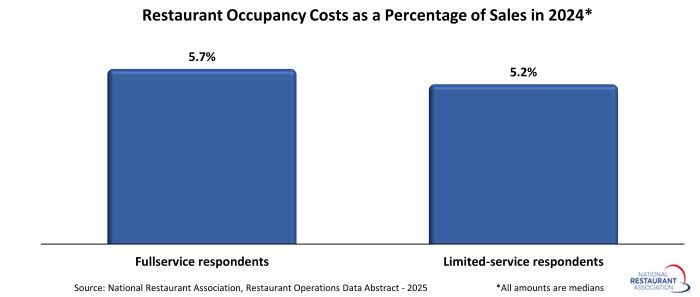
Among fullservice respondents to the survey, occupancy costs represented a median of 5.7% of sales in 2024. Occupancy costs represented a median of 5.2% of sales among limited-service survey respondents.
Those readings were generally on par with previous editions of this report. On average in the 2010, 2013 and 2016 reports, occupancy costs represented approximately 5.8% of sales among both fullservice and limited-service survey respondents.
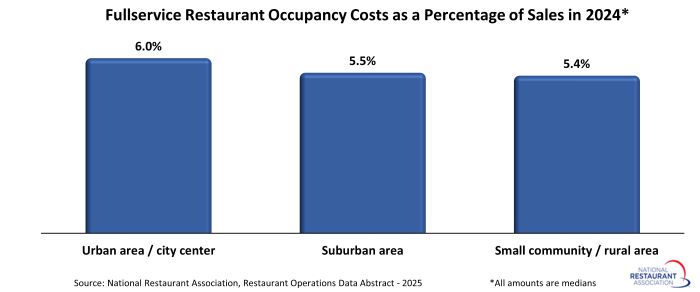
Not surprisingly, occupancy costs can vary based on the location of a restaurant. Occupancy costs at fullservice restaurants in urban areas or city centers represented a median of 6.0% of sales in 2024. That was roughly a half-percentage-point above the median for fullservice restaurants in suburban areas (5.5%) and small communities or rural areas (5.4%).
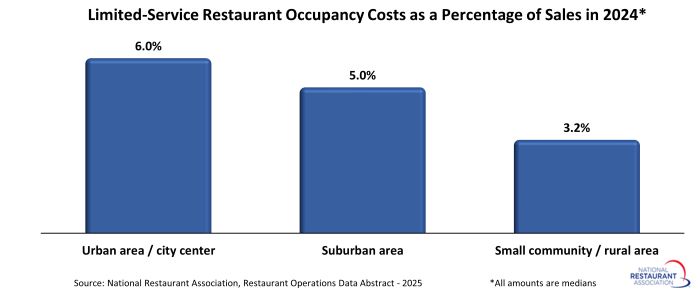
The differences are even more stark in the limited-service segment. Among limited-service restaurants located in an urban area or city center, occupancy costs were a median of 6.0% of sales in 2024. That was significantly above occupancy costs’ median share of sales for limited-service restaurants located in suburban areas (5.0%) and small communities or rural areas (3.2%).
In addition to occupancy costs, the Abstract contains data for several other cost categories, such as labor, food, utilities, marketing and more. Additionally, the data is presented by various attributes, including average check size, annual sales volume, size of community and restaurant location.
This information can help restaurant operators sharpen financial performance and identify cost categories where data could substantially vary by type of operation. By analyzing operating costs, restaurant operators may detect potential problems, determine how to manage costs, and become more efficient.
The 2025 edition of the Restaurant Operations Data Abstract is available for purchase on the Association’s store.
Note: The data in the 2025 Restaurant Operations Data Abstract is not intended to represent standards or goals for individual restaurants, nor is the report an attempt by the National Restaurant Association to set or adjust industry prices or operating ratios. Rather, the data and related ‘Analyze Your Operation’ worksheet are intended to be used as management tools to help restaurant operators gauge their restaurant’s performance.