Research
July 24, 2025
Time Use in 2024: Eating and Drinking Trends
Last month, the Bureau of Labor Statistics released its annual American Time Use Survey, offering a revealing snapshot of how the average person spends a typical day. On average, individuals slept 9.04 hours per day, spent 2.01 hours on household activities, and devoted 7.60 hours to work-related tasks. They also enjoyed 5.82 hours of leisure time, which included watching television, exercising, and participating in recreational activities. These averages vary notably between weekdays and weekends or holidays, as well as across demographic factors such as age, gender, race and ethnicity, educational attainment, employment status, and occupation.
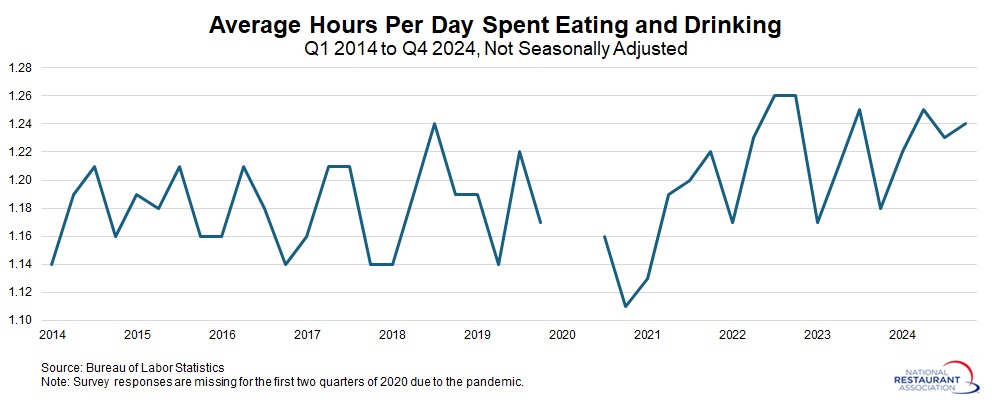
More importantly for the restaurant industry, the average person spent 1.24 hours—or 74.4 minutes—per day eating and drinking. This breaks down to 1.18 hours (70.8 minutes) on nonholiday weekdays and 1.36 hours (81.6 minutes) on weekends and holidays.
The survey does not specify where this time was spent, so it’s unclear how much occurred at restaurants versus at home. However, based on USDA data, 58.5% of total food expenditures in 2024 were for food away from home, underscoring the significance of restaurants in consumer spending.
One notable insight: since the pandemic, people appear to be spending slightly more time eating and drinking. Over the past decade, the average has risen by 4.2 minutes per day, suggesting a modest but measurable shift in daily routines. With that said, it is unclear from the data why this pattern exists.
What is particularly interesting about the slight uptick in time spent eating and drinking is that it coincides with rising productivity at restaurants—driven in part by a reduction in time spent on-site, as more consumers opt for take-out and delivery. This finding aligns with research published earlier this year by the National Bureau of Economic Research.

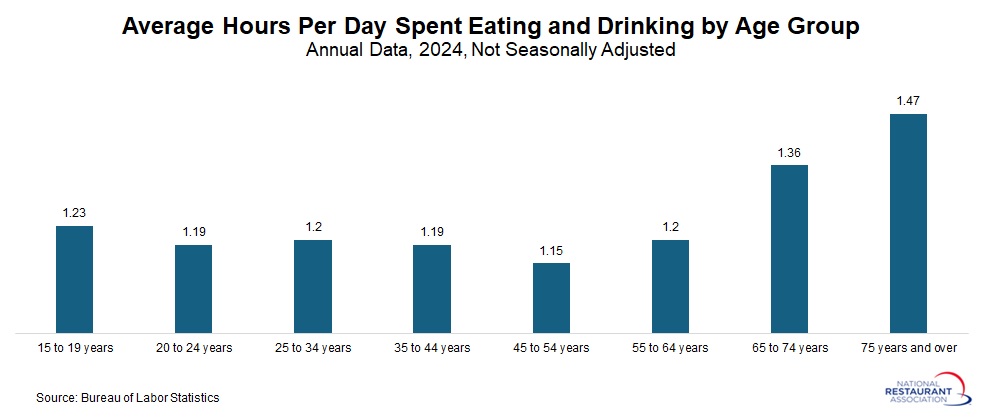
By age group, adults 65 and older spend the most time eating and drinking. Those aged 65 to 74 average 1.36 hours (81.6 minutes) per day, while individuals 75 and older spend 1.47 hours (88.2 minutes) daily on the activity. In contrast, adults aged 45 to 54 devote just 1.15 hours (69 minutes) per day to eating and drinking, the lowest among all age groups.
For other breakouts of the data, see the link above or the main page for the American Time Use Survey.

More importantly for the restaurant industry, the average person spent 1.24 hours—or 74.4 minutes—per day eating and drinking. This breaks down to 1.18 hours (70.8 minutes) on nonholiday weekdays and 1.36 hours (81.6 minutes) on weekends and holidays.
The survey does not specify where this time was spent, so it’s unclear how much occurred at restaurants versus at home. However, based on USDA data, 58.5% of total food expenditures in 2024 were for food away from home, underscoring the significance of restaurants in consumer spending.
One notable insight: since the pandemic, people appear to be spending slightly more time eating and drinking. Over the past decade, the average has risen by 4.2 minutes per day, suggesting a modest but measurable shift in daily routines. With that said, it is unclear from the data why this pattern exists.
What is particularly interesting about the slight uptick in time spent eating and drinking is that it coincides with rising productivity at restaurants—driven in part by a reduction in time spent on-site, as more consumers opt for take-out and delivery. This finding aligns with research published earlier this year by the National Bureau of Economic Research.

By age group, adults 65 and older spend the most time eating and drinking. Those aged 65 to 74 average 1.36 hours (81.6 minutes) per day, while individuals 75 and older spend 1.47 hours (88.2 minutes) daily on the activity. In contrast, adults aged 45 to 54 devote just 1.15 hours (69 minutes) per day to eating and drinking, the lowest among all age groups.
For other breakouts of the data, see the link above or the main page for the American Time Use Survey.
