Research
October 02, 2026
Total restaurant industry jobs
Restaurant employment remains on a modest growth trajectory
Restaurants expanded payrolls for the second consecutive month in September, though the uneven readings during the last several months indicate the industry remains in a period of modest growth.
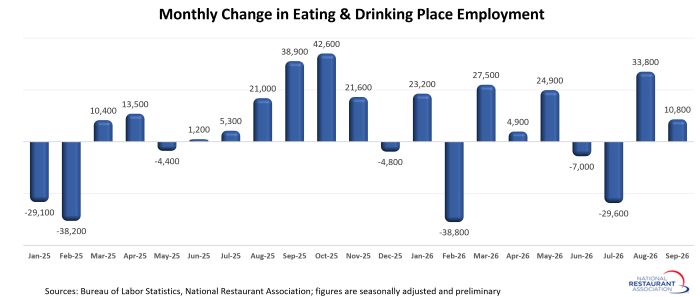
Eating and drinking places added a net 10,800 jobs in September on a seasonally-adjusted basis, according to preliminary data from the Bureau of Labor Statistics (BLS). That followed a gain of 33,800 jobs in August, a reading that was revised significantly lower from the preliminary estimate of nearly 60,000 jobs added.
The gains of the last two months followed job losses in both June and July, which is indicative of the uneven pattern that has been the norm for the last year.
Despite the choppy trendline on a month-to-month basis, restaurant employment continues to drift higher. Eating and drinking places added nearly 50,000 jobs during the first nine months of 2026, with employment levels up 109,000 from year-ago readings.
The current period of modest job growth will likely remain in place for the next several months. Until business conditions improve markedly and customer traffic picks up, most operators will likely keep staffing levels relatively steady.
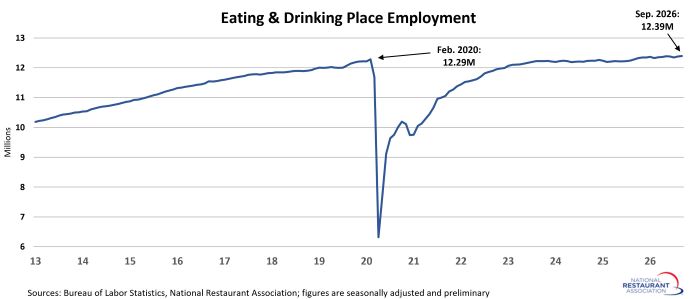
Despite the uneven job growth in recent months, the size of the restaurant workforce remains above pre-pandemic readings. As of September 2026, eating and drinking place employment was 108,000 jobs (or 0.9%) above its February 2020 level.
Fullservice segment remains nearly 175k jobs below pre-pandemic levels
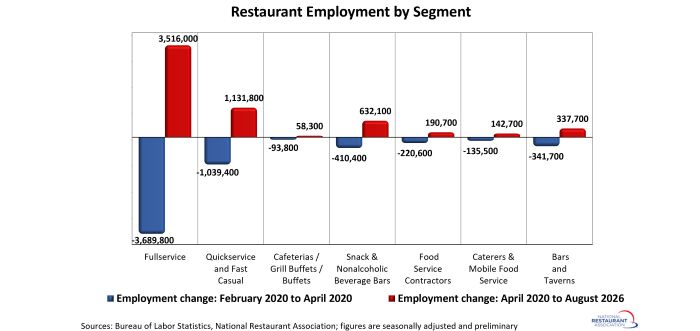
The fullservice segment lost nearly 3.7 million jobs during the first two months of the pandemic, and it has yet to fully recover. As of August 2026, fullservice restaurant employment was still 174,000 jobs (or 3%) below pre-pandemic readings.
However, fullservice restaurants expanded payrolls at a stronger pace in recent months, after lagging behind for much of the post-pandemic expansion. The fullservice segment added a net 88,000 jobs during the last 12 months. In comparison, the three limited-service segments added a combined 76,000 jobs during that same period.
Despite the slower growth in recent months, limited-service employment levels stand well above their pre-pandemic readings. As of August 2026, employment at snack and nonalcoholic beverage bars – including coffee, donut and ice cream shops – was 222,000 jobs (or 27%) above February 2020 levels.
Employee counts at quickservice and fast casual restaurants were 92,000 jobs (or 2%) above pre-pandemic levels.
[Note that the segment-level employment figures are lagged by one month, so August 2026 is the most current data available.]
Restaurant job growth uneven across states
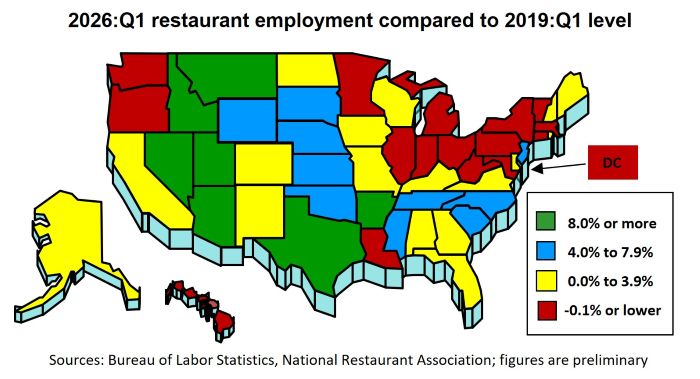
More than 6 years after the onset of the pandemic in the U.S., restaurant staffing levels remain below pre-pandemic readings in 16 states and the District of Columbia.
That group was led by Vermont and the District of Columbia, which had 8% fewer eating and drinking place jobs in the first quarter of 2026 than they did in the first quarter of 2019. Massachusetts (-6%), West Virginia (-5%) and Maryland (-5%) were also well below their pre-pandemic restaurant employment levels.
In contrast, restaurant employment in several of the mountain states has climbed well beyond pre-pandemic levels. This group is led by Utah (+15%), Nevada (+15%) and Idaho (+13%).
[Note that the state-level analysis uses 2019 as the pre-pandemic comparison instead of February 2020, because seasonally-adjusted employment figures are not available for every state.]
View the latest employment data for every state.
Note: Eating and drinking places are the primary component of the total restaurant and foodservice industry, providing jobs for roughly 80% of the total restaurant and foodservice workforce of more than 15.7 million.
Track more economic indicators and read more analysis and commentary from the Association's economists.
Eating and drinking places added a net 10,800 jobs in September on a seasonally-adjusted basis, according to preliminary data from the Bureau of Labor Statistics (BLS). That followed a gain of 33,800 jobs in August, a reading that was revised significantly lower from the preliminary estimate of nearly 60,000 jobs added.
The gains of the last two months followed job losses in both June and July, which is indicative of the uneven pattern that has been the norm for the last year.
Despite the choppy trendline on a month-to-month basis, restaurant employment continues to drift higher. Eating and drinking places added nearly 50,000 jobs during the first nine months of 2026, with employment levels up 109,000 from year-ago readings.
The current period of modest job growth will likely remain in place for the next several months. Until business conditions improve markedly and customer traffic picks up, most operators will likely keep staffing levels relatively steady.
Despite the uneven job growth in recent months, the size of the restaurant workforce remains above pre-pandemic readings. As of September 2026, eating and drinking place employment was 108,000 jobs (or 0.9%) above its February 2020 level.
Fullservice segment remains nearly 175k jobs below pre-pandemic levels
The fullservice segment lost nearly 3.7 million jobs during the first two months of the pandemic, and it has yet to fully recover. As of August 2026, fullservice restaurant employment was still 174,000 jobs (or 3%) below pre-pandemic readings.
However, fullservice restaurants expanded payrolls at a stronger pace in recent months, after lagging behind for much of the post-pandemic expansion. The fullservice segment added a net 88,000 jobs during the last 12 months. In comparison, the three limited-service segments added a combined 76,000 jobs during that same period.
Despite the slower growth in recent months, limited-service employment levels stand well above their pre-pandemic readings. As of August 2026, employment at snack and nonalcoholic beverage bars – including coffee, donut and ice cream shops – was 222,000 jobs (or 27%) above February 2020 levels.
Employee counts at quickservice and fast casual restaurants were 92,000 jobs (or 2%) above pre-pandemic levels.
[Note that the segment-level employment figures are lagged by one month, so August 2026 is the most current data available.]
Restaurant job growth uneven across states
More than 6 years after the onset of the pandemic in the U.S., restaurant staffing levels remain below pre-pandemic readings in 16 states and the District of Columbia.
That group was led by Vermont and the District of Columbia, which had 8% fewer eating and drinking place jobs in the first quarter of 2026 than they did in the first quarter of 2019. Massachusetts (-6%), West Virginia (-5%) and Maryland (-5%) were also well below their pre-pandemic restaurant employment levels.
In contrast, restaurant employment in several of the mountain states has climbed well beyond pre-pandemic levels. This group is led by Utah (+15%), Nevada (+15%) and Idaho (+13%).
[Note that the state-level analysis uses 2019 as the pre-pandemic comparison instead of February 2020, because seasonally-adjusted employment figures are not available for every state.]
View the latest employment data for every state.
Note: Eating and drinking places are the primary component of the total restaurant and foodservice industry, providing jobs for roughly 80% of the total restaurant and foodservice workforce of more than 15.7 million.
Track more economic indicators and read more analysis and commentary from the Association's economists.