Research
March 06, 2026
Total restaurant industry sales
Restaurant sales dipped 0.2% in January
Restaurant sales edged lower in January, as consumer activity in much of the country was dampened by challenging weather conditions.
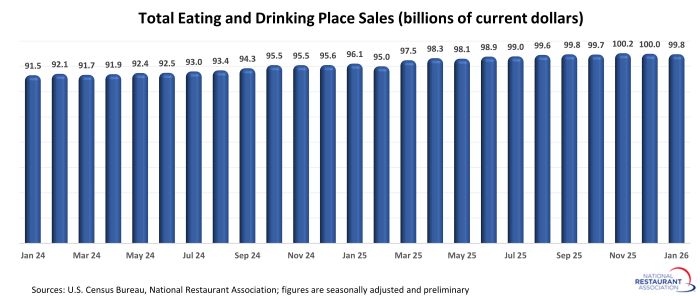
Eating and drinking places registered total sales of $99.8 billion on a seasonally adjusted basis in January, according to preliminary data from the U.S. Census Bureau. That was down slightly from December’s sales volume of $100.0 billion.
January represented the second consecutive downtick in restaurant sales, after peaking at $100.2 billion in November. Despite the recent soft patch, eating and drinking place sales stood 3.9% above their year-ago level in January. While that was down from 12-month gains of nearly 7% in mid-2025, the trendline continued to point in a positive direction.
Looking beyond the recent softness, the underlying fundamentals of the economy remain generally positive, which points toward continued growth in 2026. Factor in the impact that changes to federal income tax laws will have on households – including both larger tax refunds and lower tax withholdings – and it’s likely that consumers on the aggregate will retain the financial wherewithal to continue spending in 2026.
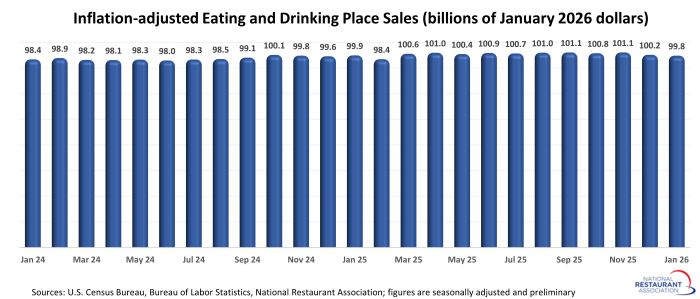
While nominal sales growth slowed in recent months, growth in menu prices remained firm. As a result, real eating and drinking place sales edged down 0.1% between January 2025 and January 2026, after adjusting for menu price inflation.
Note: Eating and drinking places are the primary component of the U.S. restaurant and foodservice industry and represent approximately 72% of total restaurant and foodservice sales.
Eating and drinking places registered total sales of $99.8 billion on a seasonally adjusted basis in January, according to preliminary data from the U.S. Census Bureau. That was down slightly from December’s sales volume of $100.0 billion.
January represented the second consecutive downtick in restaurant sales, after peaking at $100.2 billion in November. Despite the recent soft patch, eating and drinking place sales stood 3.9% above their year-ago level in January. While that was down from 12-month gains of nearly 7% in mid-2025, the trendline continued to point in a positive direction.
Looking beyond the recent softness, the underlying fundamentals of the economy remain generally positive, which points toward continued growth in 2026. Factor in the impact that changes to federal income tax laws will have on households – including both larger tax refunds and lower tax withholdings – and it’s likely that consumers on the aggregate will retain the financial wherewithal to continue spending in 2026.
While nominal sales growth slowed in recent months, growth in menu prices remained firm. As a result, real eating and drinking place sales edged down 0.1% between January 2025 and January 2026, after adjusting for menu price inflation.
Note: Eating and drinking places are the primary component of the U.S. restaurant and foodservice industry and represent approximately 72% of total restaurant and foodservice sales.