Restaurant Performance Index rose 0.2% in June
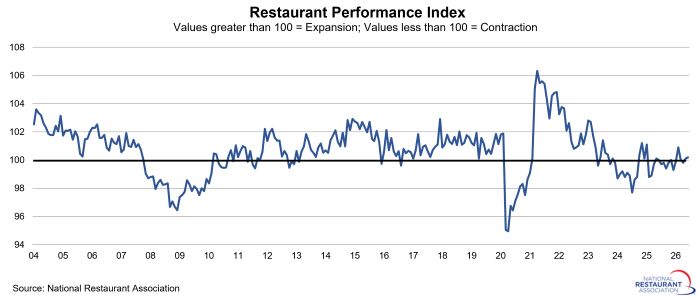
The National Restaurant Association’s Restaurant Performance Index (RPI) rose for the second consecutive month in June, but still reflected an uncertain business environment. The RPI – a monthly index that tracks the health of the U.S. restaurant industry – stood at 100.2 in June, up 0.2% from May and the second straight month that the index stood above 100 in expansion territory.
Continuing the trend of the last several months, restaurant operators reported a net increase in same-store sales and a net decline in customer traffic. Restaurant operators have a mixed outlook for business conditions in the months ahead, with cautiously positive sales expectations offset by a more pessimistic outlook for the overall economy.
The Current Situation Index, which measures current trends in four industry indicators, stood at 100.1 in June – up 0.4% from a level of 99.7 in May. June represented third consecutive monthly increase and the first time in four months that the current situation component stood above 100 in expansion territory.
The Expectations Index, which measures restaurant operators’ six-month outlook for four industry indicators, stood at 100.4, unchanged from the previous month. Restaurant operators remain more optimistic about their own sales prospects than they are about the direction of the overall economy.
RPI Methodology
The National Restaurant Association's Restaurant Performance Index (RPI) is a monthly composite index that tracks the health of the U.S. restaurant industry. Launched in 2002, the RPI is released on the last business day of each month.
The RPI is measured in relation to a neutral level of 100. Index values above 100 indicate that key industry indicators are in a period of expansion, while index values below 100 represent a period of contraction for key industry indicators. The Index consists of two components — the Current Situation Index, which measures current trends in four industry indicators (same-store sales, traffic, labor and capital expenditures), and the Expectations Index, which measures restaurant operators’ six-month outlook for four industry indicators (same-store sales, employees, capital expenditures and business conditions).
The RPI is based on the responses to the National Restaurant Association’s Restaurant Industry Tracking Survey, which is fielded monthly among restaurant operators nationwide on a variety of indicators including sales, traffic, labor and capital expenditures. Restaurant operators interested in participating in the tracking survey: contact Bruce Grindy.
Updated 7/31/2026